

sample project · synthetic data
production KPI dashboard
from raw production records to a one-page dashboard that shows where output is lost: OEE, downtime and scrap for three lines over six months.
- SQL
- Python
- pandas

- 74.1%overall OEE
- 81.0%best line (Line A)
- 66.9%weakest line (Line C)
- 966 hdowntime recorded
the dashboard
one page, four questions answered
how is OEE trending, which line is weakest, where is time lost, and is quality holding? the picture below is generated by the script in the project folder.
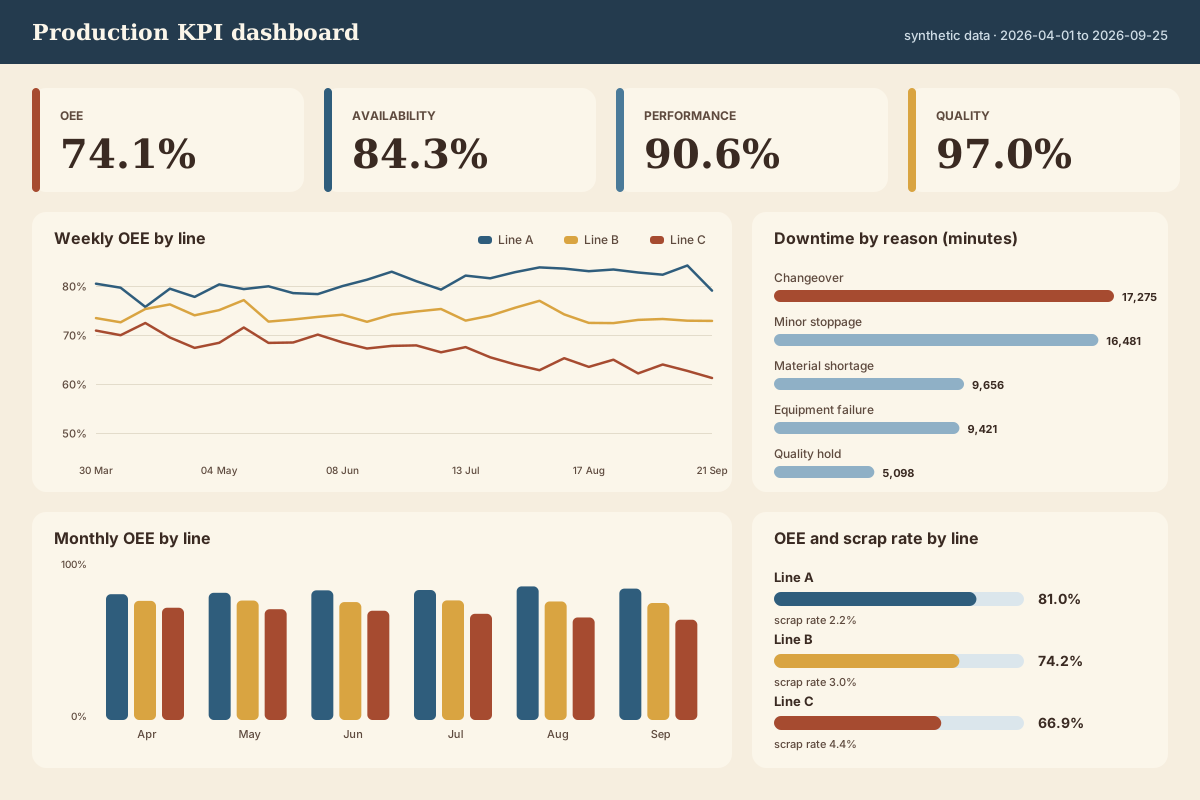
the layout is drawn with Python so that the data and code stay open to read. the same measures can be rebuilt as a Power BI report. all data in this project is synthetic: random numbers with a fixed seed, no real company or person.
from question to result
how the project went
the challenge
a plant runs three production lines, but management only sees one overall OEE number. nobody can say which line loses the most output, or why.
the approach
I combined the daily production records with the list of stoppages, calculated availability, performance and quality with SQL, cross-checked the numbers in Python and built a one-page dashboard.
the result
Line C has the lowest OEE (66.9%), and it fell from 69.2% in the first half to 64.5% since July. Changeover and minor stoppage together cause 58% of all lost minutes.
the data and the code
everything is in the project folder
you can open every file, rerun the scripts and get the same result. nothing is hidden behind a screenshot.

- README.mdwhat the project is and how to run it1 KB
- data/production_log.csvone row per line per day: planned time, downtime, units, scrap14 KB
- data/downtime_events.csvevery stoppage with its reason and length34 KB
- sql/monthly_oee.sqlthe SQL that calculates monthly availability, performance, quality and OEE1 KB
- src/oee_analysis.pyruns the SQL, cross-checks in pandas and draws the dashboard7 KB
- output/kpi_monthly.csvthe monthly results table815 B
run it yourself
pip install pandas
python src/generate_data.py
python src/oee_analysis.py
free consultation
want a dashboard like this for your lines?
message me on whatsapp and tell me what you would like to track. the first consultation is free.
 chat with me on whatsapp
not ready to chat? send me an email instead.